

- Introduction
- Manual testing
- Autoit
- Ant
- Agilitest
- Bat
- Bat With Params
- Beanshell
- Cerberus
- Cucumber
- Cucumber v2 (BDD & Gherkin support)
- eTASQ Motion (Ponant)
- Executable
- FitNesse
- Gatling
- Generic Version-Control
- Git, Gitlab, Github
- Gradle
- Java
- Jar
- JMeter
- JMeter SQL
- JMeter Web
- JUnit
- Katalon
- Katalon v2
- Marathon
- Maven
- Mocha
- NeoLoad
- NUnit
- Odin Axe
- Odin Axe Results
- Offline
- Perl
- PHPUnit
- Postman (Newman)
- Protractor
- Python
- PyUnit
- PyTest
- QF-Test
- Quick Test Pro/UFT
- Ranorex
- Rapise
- RobotFramework
- RobotFramework v2
- RobotFramework v3
- RobotFramework v4
- Sahi
- Sahi 3.5
- Sahi 4.0
- Sahi 6.0
- Selenese
- Selenium HTML
- Selenium 3
- Selenium Java
- Selenium .NET
- Selenium Python
- Shell
- Sikuli
- SikuliX
- SilkTest
- SoapUI
- SoapUI Load
- SoapUI Security
- SOATest
- SQL Compare
- SQL Select
- Squish
- SVN (Subversion)
- Tape
- Tcl
- TestComplete
- TestComplete v2
- TestExecute
- TestExecute v2
- TestNG
- TestOptimal
- TestOptimal Simple
- TestPartner
- TestStand
- VisualStudio
- VisualStudio Coded UI
- WAPT
- WebdriverIO
- WebUI
- XCI
- xUnit.net
- Success (skeleton)
- Random (skeleton)
- Proxy
JMeter Web launcher (jmeter_web.jar)
The JMeter Web launcher allows running load testings on web sites.It has been tested with JMeter v2.4.
Configuration
Thejmeter_web.xml file is just a template and must NOT be edited. It's used by the system to build dynamically the form that the user will be able to fill in from the GUI when creating a custom execution configuration.| Parameter | Description |
| General | |
| Java install path | This must indicate the path to the java install. Default value is: C:/Program Files/Java/jdk1.6.0_17
|
| Test root path | This must indicate where are located all the JMeter tests. This is a root path. Each test in XStudio has a canonical path that will be appended to this path. This path MUST not include an ending slash. Default value is: C:/test_repository/tests/jmeter
|
| Connection timeout (seconds) | This must indicate the connection timeout value. Default value is: 30
|
| Request timeout (seconds) | This must indicate the request timeout value. Default value is: 30
|
| Acceptable failure rate (%) | This must indicate the acceptable failre rate. Default value is: 0
|
| Nb simulated users | This must indicate the number of simulated users. Default value is: 100
|
| Time to reach max load (seconds) | This must indicate the time to reach the max load. Default value is: 60
|
| Nb requests per user | This must indicate the number of request sent per user. Default value is: 3
|
| Nb values to compute max time | This must indicate the number of values measured to calculate the request max time.
By default, the declared max time will be the average of the 3 biggest times. Default value is: 3
|
| JMeter | |
| JMeter install directory | This must indicate where JMeter has been installed. Default value is: C:/jakarta-jmeter-2.4
|
| Temporary folder | This must indicate the path of a folder where we are going to store temporary data. Default value is: C:/WINDOWS/Temp
|
These values can be changed while creating the campaign session from XStudio.
Note about file path parameters:
Any parameter referring to a file or folder path (for instance Test root path) can be provided either using
On windows, if you provide a path containing an OS-localizable folder such as
Any parameter referring to a file or folder path (for instance Test root path) can be provided either using
\ separator (if the tests are going to be executed on a Windows agent) or / separator (if the tests are going to be executed on a linux or MacOSX agent).On windows, if you provide a path containing an OS-localizable folder such as
C:\Program Files, always prefer the English version (i.e. NOT C:\Programmes if you're using a french-localized Windows) or the corresponding native environment variable (i.e. %PROGRAMFILES%).
Process
The launcher will first take care about running the JMeter server. Do NOT run the server by yourself.The tests must be named with the extension .web and contain description of command executed on the website.
For instance:
    url=http://192.168.10.104/index.html port=8080

    method=POST

    param=login value=johndoe

    param=password value=foobar

    param=request value=account

    url=http://192.168.10.104/index.html port=8080

    method=GET

    param=login value=johndoe

    param=password value=foobar

    param=command value=33552422

    url=http://192.168.10.104/view_command.php port=8080

    method=GET

    param=login value=johndoev
    param=password value=foobar

    param=command value=34620263
IMPORTANT: the JMeter launcher expects to get results in a .jtl file formatted in XML (and not CSV that is the default value but that contains less information).
You can ensure JMeter generates .jtl formatted in XML by checking in the
You can ensure JMeter generates .jtl formatted in XML by checking in the
bin/jmeter.properties file that the following property is present:jmeter.save.saveservice.output_format=xml
The JMX tests are generated dynamically from these tests and executed by the launcher.
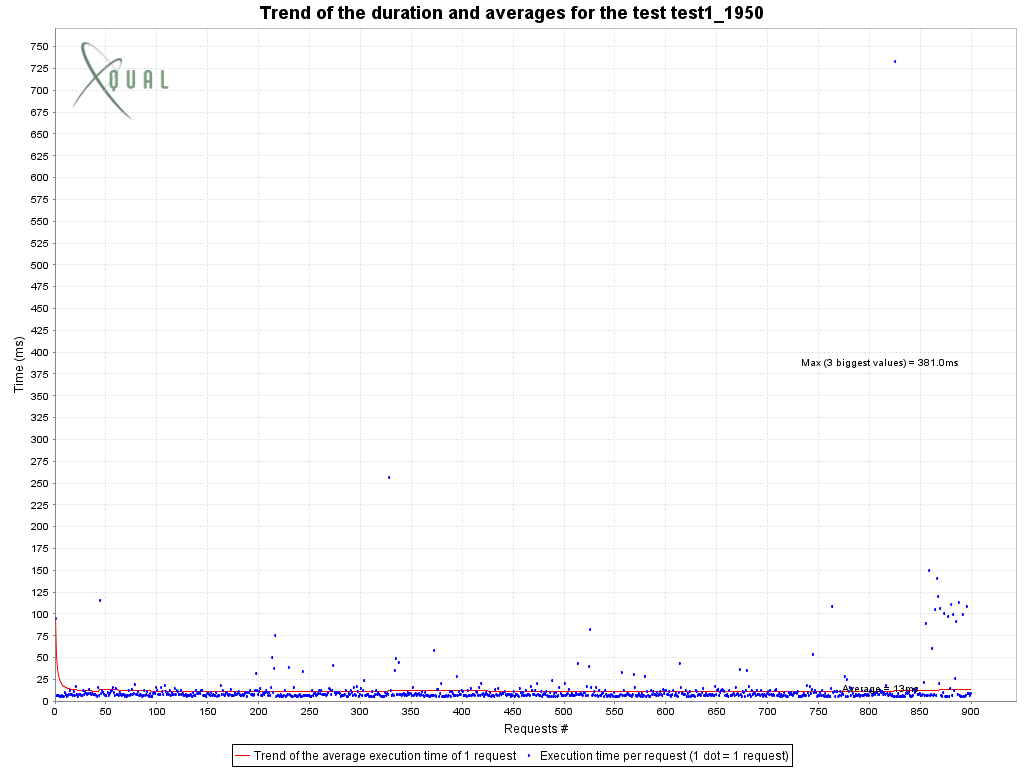
At the end of the test execution, a chart is generated by the launcher based on the JTL results produced by JMeter and uploaded to XStudio. All the logs are also attached to the testcase execution in XStudio. The test will be marked as passed or failed depending on the failure rate measured by JMeter.
Tutorial: Creating and executing JMeter Web tests
In this tutorial, we will learn to run some JMeter load tests.Prerequisites
Install JMeter in the folderC:\\jakarta-jmeter-2.4Create a file
Test1.web in the folder C:\\test_repository\\tests\\jmeter\\folder1.Open this file and copy the following in it:
    url=http://192.168.10.104/index.html port=80

    method=POST

    param=login value=johndoe

    param=password value=foobar

    param=request value=account

    url=http://192.168.10.104/index.html port=80

    method=GET

    param=login value=johndoe

    param=password value=foobar

    param=command value=33552422
Create a dedicated category for JMeter Web tests and create a test
- create a category JMeter SQL associated to the launcher jmeter_web.jar
- under this category, create (somewhere in the tree) a test with name Test1 and with a canonical path set to folder1.
Creating a test campaign
- create a campaign including only the test Test1
- create a campaign session using a configuration having all the default values.
Run a campaign session
Run the campaign sessionAfter the session's execution is completed, you can look at the results from XStudio:
- the messages indicate the failure rate and the average time to execute the queries
- you can also check that all the log files (including the JMX, the JTL and the log files) are attached as well as a chart which looks like:
Permissions
WARNING: if you're running your tests on Windows, it may be required to run the tests as administrator.
Having an account with Administrators permissions may even not be enough in some cases (especially if you're using Windows 10) and you may need to disable completely the UAC (User Access Control) on your computer.
To do so:
Having an account with Administrators permissions may even not be enough in some cases (especially if you're using Windows 10) and you may need to disable completely the UAC (User Access Control) on your computer.
To do so:
- Press the
Windows + Rkey combination - Type in
regedit - Go to HKEY_LOCAL_MACHINE\SOFTWARE\Microsoft\Windows\CurrentVersion\Policies\System
- In the right-side pane, look for EnableLUA and set the value
0 - Close the registry editor
- Restart your computer
Debug
If your tests are not executed correctly or are reporting only failures, this is very likely because your configuration is incorrect or because you used a wrong naming convention for your tests and test cases.
The best way to quickly find out what's wrong is to look at the traces generated by XStudio (or XAgent).
The traces always include the detailed description of what the launcher performs (command line execution, script execution, API calling etc.) to run a test case. So, if you experiment some problems, the first thing to do is to activate the traces and look at what's happening when you run your tests.
Then, try to execute manually in a
This will normally fail the same way.
At this point, you needs to figure out what has to be changed in these commands in order to have them run properly.
When you have something working, compare these commands to what's described in the Process chapter above. This will tell you exactly what you need to change.
Most of the time, this is related to:
The best way to quickly find out what's wrong is to look at the traces generated by XStudio (or XAgent).
The traces always include the detailed description of what the launcher performs (command line execution, script execution, API calling etc.) to run a test case. So, if you experiment some problems, the first thing to do is to activate the traces and look at what's happening when you run your tests.
Then, try to execute manually in a
cmd box the exact same commands.This will normally fail the same way.
At this point, you needs to figure out what has to be changed in these commands in order to have them run properly.
When you have something working, compare these commands to what's described in the Process chapter above. This will tell you exactly what you need to change.
Most of the time, this is related to:
- some incorrect values in some parameters of your configuration,
- the name of your tests,
- the name of your test cases,
- the canonical path of your tests