

Smarter kpis drive smarter decisions - part 3
Quality
Keywords:
Quality
Smart KPIs
Risk Management
Decisions
Quality
Smart KPIs
Risk Management
Decisions
Abstract: This paper addresses the need for
smarter metrics for managers to make the
right decisions during a Sprint, a project or a
program, but also to make the call when to ship
a new release in production or to consumers.
The vast majority of organizations still make such decisions based on SWAG 1 rather than documented metrics that matter. XQual brings a set of automated and real time KPIs 2 to help in this.
This paper explains how this works using XQual's Quality score.
All this builds on the scope, specifiability and testability notions addressed in the first paper of this series (part 1) and in the second paper of this series (part 2) and describes the major advantages that this brings. Ensure reading those two papers first.
Summary
Introduction
In the first paper of this series (part 1) and in the second paper of this series (part 2), we introduced the reasons why managers need to know more than just "are we
progressing fast enough?". We also explained in detailed how the weighted requirement coverage (Scope), weighted specification coverage (Specifiability) and weighted test coverage (Testability) KPIs can tremendously help managers to make decisions during the project or sprint lifecycle.
In this paper, we address and extend these notions to cover the Quality score KPI.
In this paper, we address and extend these notions to cover the Quality score KPI.
Quality
When dealing with quality, it is difficult to define a single index that measures it.There are as many views on the topic as there are experts in the field. Nonetheless, it is interesting to get a single index that combines the various basics metrics. But this does not prevent from analyzing the trend on those basic metrics to understand what affects the quality index.
In addition, defining an achievable quality score is part of any test and release management strategy (e.g. our goal is to achieve over 50% quality on the version 1, and 78% quality on the version 2).
Remember that this is only a KPI, not true measure of the actual quality. This indeed should be managed as part of your production metrics (e.g. MTBF 3, MTTR 4, nb of patches per period etc.).
Still, being able to take an educated decision about the opportunity and the risk of pushing a new release to production is a must have for any organization.
Looking at the following diagram (Figure 1), we would be aware that pushing this release to production would be a risky business. Although the scope, specifiability and testability are fine, we can see that the quality is a lot behind. More efforts are needed on the execution of the tests, or we need to reduce the scope or we may even have to focus the next sprint on stabilizing this release. This is probably due to the fact that we increased the scope too soon ignoring the quality score. Very bad!
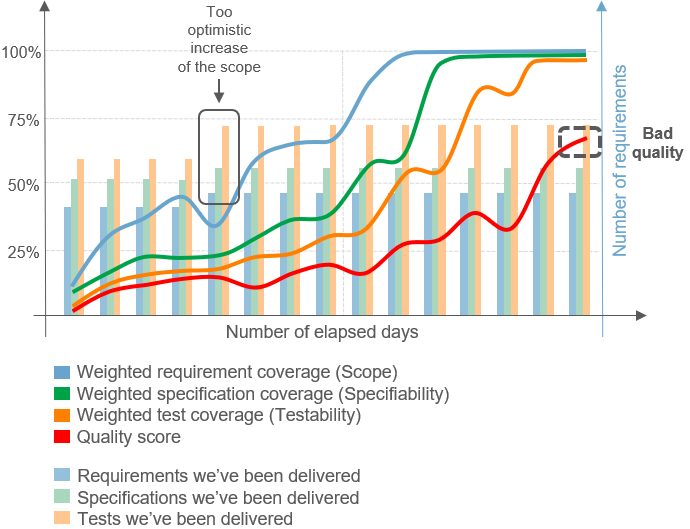
Figure 1: Bad quality
One way to correct it would probably have been to not increase the scope too soon so that the effort on test execution and test correction are more focused.
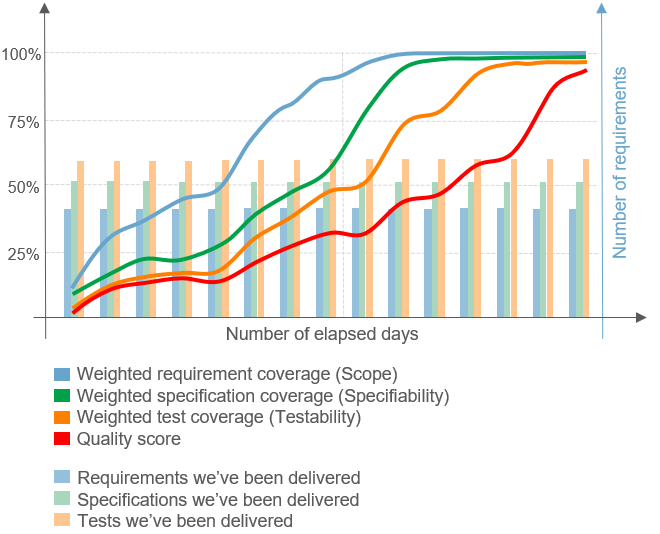
Figure 2: Corrected quality
In some more complex cases, the scope will be quite dynamic and will impact immediately the specifiability, testability and quality curves. In such case, having a real-time quality score graph is a must have to undertake the right corrective actions as soon as possible to get a proper quality at the end of the sprint.
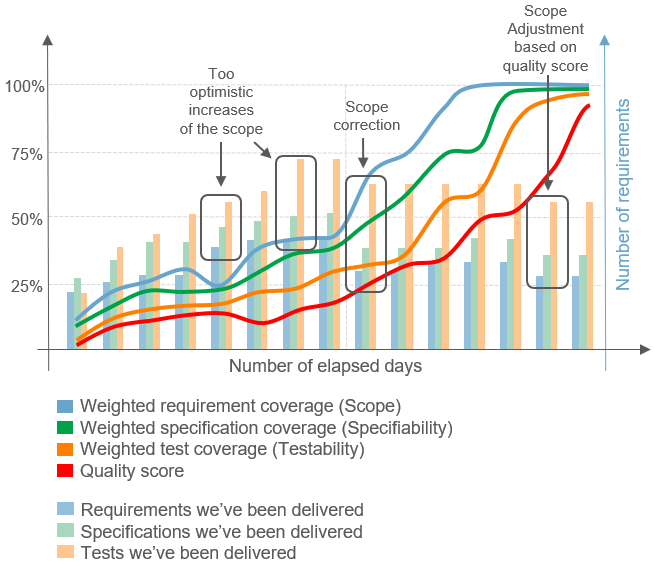
Figure 3: Quality progress
Conclusion:
WE'VE SEEN 4 DIFFERENT BUT RELATED KPIS IN THE THREE PAPERS OF THIS SERIES:
AT ANY TIME, YOU CAN ANALYZE THE TRUE STATUS OF YOUR PROJECT AND MAKE SMART DECISIONS. AT THE END OF ANY CYCLE (SPRINT, RELEASE, PROJECT), YOU HAVE THE TOOLS TO DECIDE WHETHER YOU WANT TO PUSH THIS TO PRODUCTION OR SHIPPING IT TO YOUR CUSTOMERS.
THOSE KPI ARE CALCULATED REAL-TIME AND THE BASIC PARAMETERS ARE ALL CONFIGURABLE, MAKING IT EASY TO ADAPT TO ANY ORGANIZATION.
- SCOPE
- SPECIFIABILITY
- TESTABILITY
- QUALITY
AT ANY TIME, YOU CAN ANALYZE THE TRUE STATUS OF YOUR PROJECT AND MAKE SMART DECISIONS. AT THE END OF ANY CYCLE (SPRINT, RELEASE, PROJECT), YOU HAVE THE TOOLS TO DECIDE WHETHER YOU WANT TO PUSH THIS TO PRODUCTION OR SHIPPING IT TO YOUR CUSTOMERS.
THOSE KPI ARE CALCULATED REAL-TIME AND THE BASIC PARAMETERS ARE ALL CONFIGURABLE, MAKING IT EASY TO ADAPT TO ANY ORGANIZATION.
References:
1 SWAG: https://en.wikipedia.org/wiki/Scientific_wild-ass_guess
2 KPI: https://en.wikipedia.org/wiki/KPI
3 MTBF: https://en.wikipedia.org/wiki/Mean_time_between_failures
4 MTTR: https://en.wikipedia.org/wiki/Mean_time_to_repair
1 SWAG: https://en.wikipedia.org/wiki/Scientific_wild-ass_guess
2 KPI: https://en.wikipedia.org/wiki/KPI
3 MTBF: https://en.wikipedia.org/wiki/Mean_time_between_failures
4 MTTR: https://en.wikipedia.org/wiki/Mean_time_to_repair