

XQual comes with dozens of built-in charts (line graphs, bar charts, pie charts and more) covering every aspect of your projects. Pick the ones that matter most to you, reference them in a catalog, and use the Custom Dashboard module to drag, drop and resize them onto your own pages - no report-building expertise required.
Group several pages into a Channel, hit play, and watch them rotate automatically with live, real-time data - shareable by URL with anyone who has the right access.
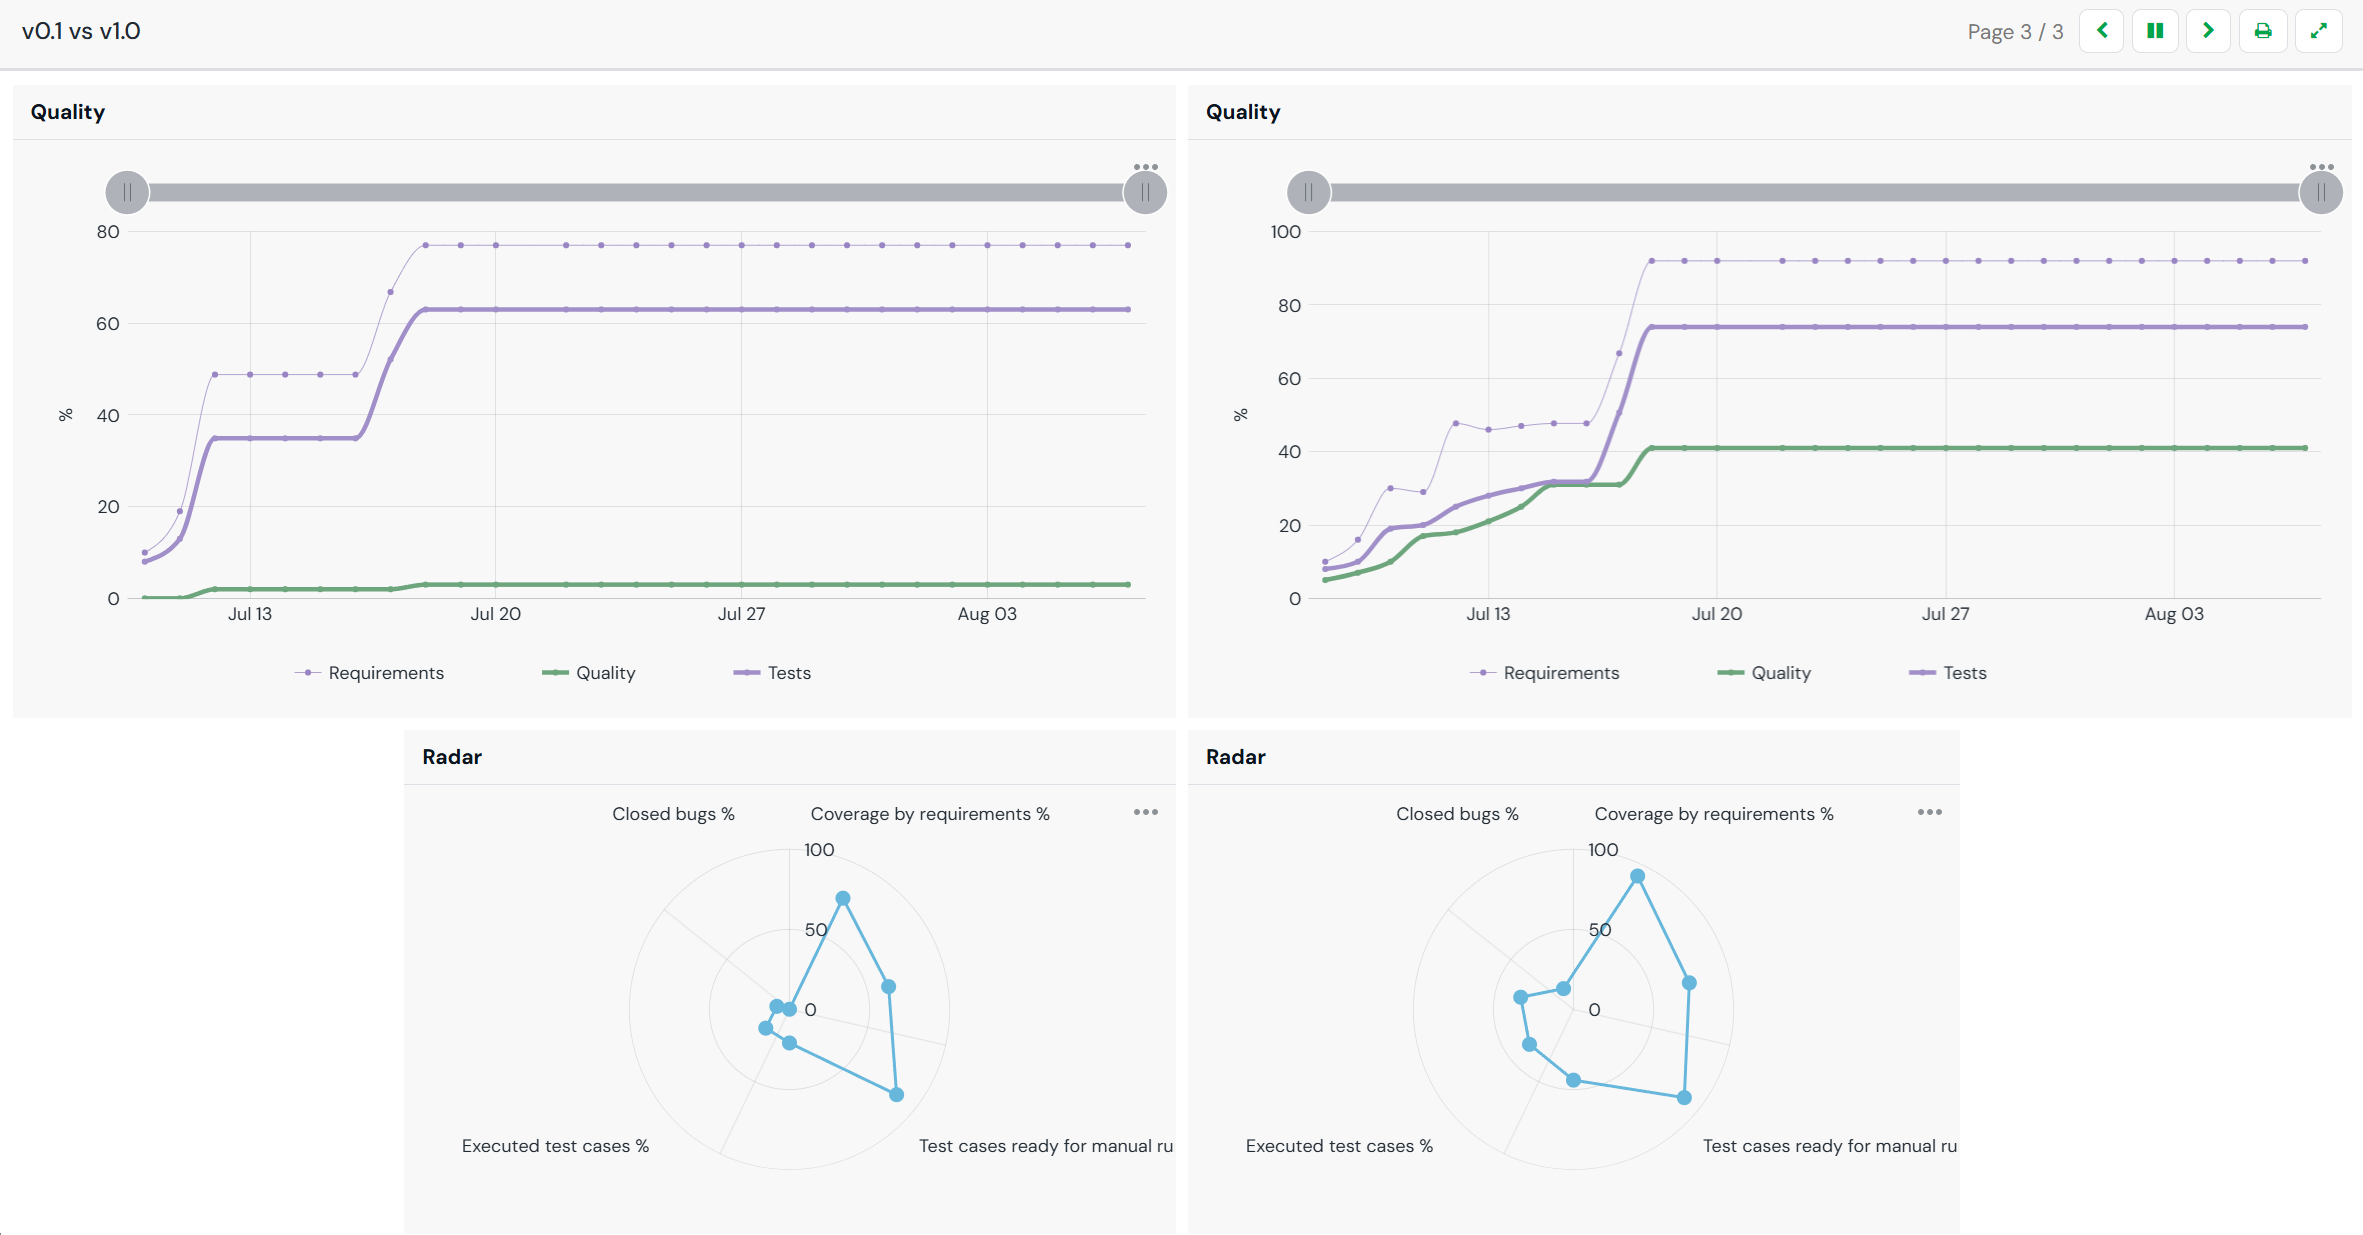
Group several pages into a Channel, hit play, and watch them rotate automatically with live, real-time data - shareable by URL with anyone who has the right access.
- Dozens of built-in, project-oriented charts (line, bar, pie and more) available in a catalog,
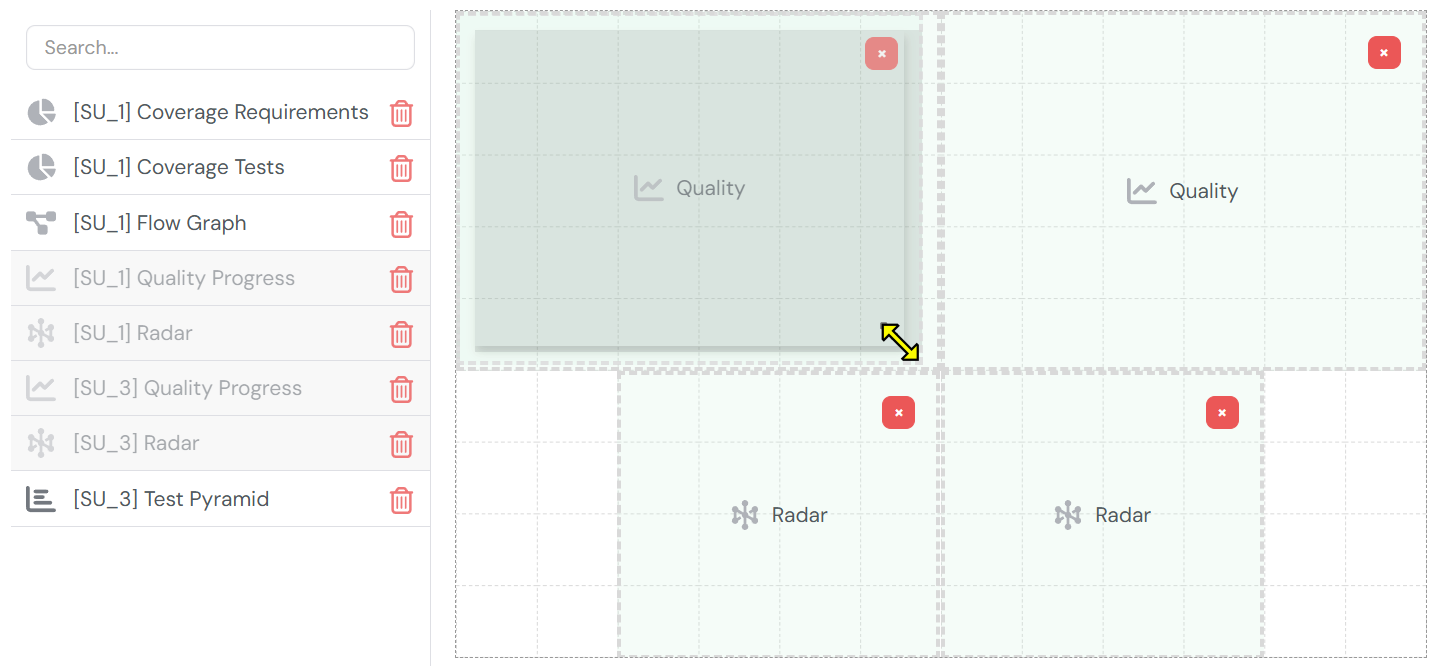
- Drag-and-drop and resize any chart onto your own custom dashboard pages,
- Group multiple pages into a Channel that rotates automatically in a loop,
- Data refreshes in real time,
- Shareable by URL - anyone with sufficient rights can display the same dashboard on their own screen.
Drag, drop and resize charts from the catalog onto your dashboard page
A Channel rotating through its pages with live, real-time data
Why Custom Dashboards
Turn raw data into instant insight- Build the exact report you need in minutes, with simple drag-and-drop - no BI tool or scripting required
- Combine any of XQual's dozens of built-in charts (line, bar, pie and more) on the same page
- Always up to date - dashboards reflect live, real-time project data
- Rotate multiple dashboards automatically via a Channel, perfect for always-on displays
- Share a single URL so everyone sees the exact same view, with proper access control
How It Works
Catalog, pages, channels- Pick the charts you care about from XQual's catalog of dozens of project-oriented graphs
- Create a dashboard page and drag, drop and resize any catalog chart onto it
- Group several pages into a Channel
- Hit "Play" on a Channel to cycle through its pages automatically, on a loop
- Every dashboard is reachable by a shareable URL for display on any screen
Who is this for
From meeting rooms to management offices- Teams wanting an always-on status screen in a meeting room or hallway showing live project progress
- Top managers who want a real-time overview of project status from their own desk
- Project/release managers building custom reports without relying on IT or a separate BI tool
- Both Cloud SaaS and On-Premise XQual customers